查看当前变量可以用who,查看当前变量及其结构,大小,类型等,可以用whos。
- 控制图的大小
figure(‘position’,[x0,y0,dx,dy]);
figure(fig number);- 控制图例(legend)
legend('leg1','leg2','Location','NorthWest');
% hide the legend box
legend boxoff
% set the color of the legend is done via latex grammar
legend('\color{red}leg1','\color{blue}leg2');
% use RGB color value in legend
legend('\color[rgb]{1,1,0}');
depend on how many lines you plot in a figure;
控制图例的相对位置
figure();
sub(1)=subplot(2,1,1);
plot(x1,y1);
leg(1)=legend('f1');
sub(2)=subplot(2,1,2);
plot(x2,y2);
leg(2)=legend('f2');
% control the relative position of legend in whole figure
leg(1).Position=[x1,y1,dx1,dy1];
leg(2).Position=[x2,y2,dx2,dy2];- 改变字体大小
change the fontsize of x,y label at the same time.
set(gca,'fontsize',15)- 显示小刻度
% show minor tick on x axis
set(gca,'XMinorTick','on');
% show minor tick on y axis
set(gca,'YMinorTick','on');- 设置线条宽度
set(gca,'LineWidth',2);- 支持Latex语法
% in xlabel, ylabel and title, you can use latex code directly
xlabel('\frac{\pi x^2}{\sqrt(y+3)}');
% but for legend, the case is a little different, you should use cell, $$ symbol and 'interpreter'
legend({'$\frac{\pi x^2}{\sqrt(y+3)}$'},'interpreter','latex'));- 从fig格式的图中读取数据
matlab中的图可以保存成fig格式,可以自由地进行编辑,有时我们还希望可以从fig文件中读取出数据,可以使用下面的代码:
h=open('data.fig');
x=h.Children.Children.XData;
y=h.Children.Children.YData;
fig1=figure();
plot(x,y);
如果图是通过subplot生成的多个子图拼成的,则提取数据的过程还会更复杂些。例如一个:subplot(2,1,:)的图。
clear all;close all;clc;
subdata=openfig('data_subplot.fig');
x1=subdata.Children(1).Children.XData;
y1=subdata.Children(1).Children.YData;
x2=subdata.Children(2).Children.XData;
y2=subdata.Children(2).Children.YData;
figure()
plot(x1,y1,x2,y2);
title('extracted data from subplot fig file');
如果字图中的曲线多于一条,最底层的Children还会再多些,但是基本的思路是类似的,同样可以从中读出数据,例如代码可能是这样的:
y21=subdata.Children(2).Children(1).YData;
y22=subdata.Children(2).Children(2).YData;
获知图的信息
在matlab中,图是一个结构体对象,可以用get(fig1)的方式来查看其对象。- 使用对数坐标[1]
figure()
plot(x,y);
% set the x axis as log scale, same operation for x axis
set(gca, 'YScale', 'log');
% to convert it back to normal axis, you can use linear scale
set(gca, 'YScale','linear');- stem[2]
stem(x,y)可以画出像毛草一样的效果,对于展示信号的振幅非常直观,如下图。
x=0:0.1:1;
figure();
stem(x,sin(x));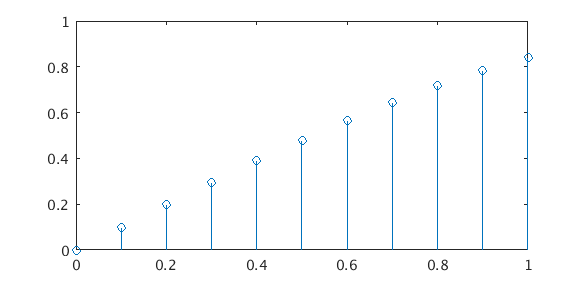
- 保存fig图
fig0=figure();
plot(x,y);
savefig(fig0,'picture.fig');- 绘制双Y轴坐标图
[ax h1 h2] = plotyy(x1,y1, x2,y2);
axes(ax(1)); ylabel('First y-label');
axes(ax(2)); ylabel('Second y-layel');
yyaxis替代plotyy
fig = figure;
left_color = [.5 .5 0];
right_color = [0 .5 .5];
set(fig,'defaultAxesColorOrder',[left_color; right_color]);
yyaxis left
ax1=plot(x1,y1);
yyaxis right
ax2=plot(x2,y2);
% yyaxis中ylim的设置
ax=get(gca);
ax.YAxis(1).Ylimits=[0,300];
ax.YAxis(2).Ylimits=[0,3];
在subplot子图中可以这样设置
% this will the set the color of Y axis
sub(2).YAxis(1).Color=[0,0,1]% blue
sub(2).YAxis(2).Color=[1,0,0]% red- 绘图2D, pcolor
x=(0:0.1:2);% 1*20
y=(0:0.2:1)';% 5*1
yx=y*x;% 5*20
figure();
pcolor(x,y,yx);
shading flat;% smooth the color edge
xlabel('x');
ylabel('y');
colorbar();
title('pcolor');- 绘图2D, contourf
figure();
contourf(x,y,yx,'edgecolor','none');
colorbar;
xlabel('x');
ylabel('y');
title('contourf');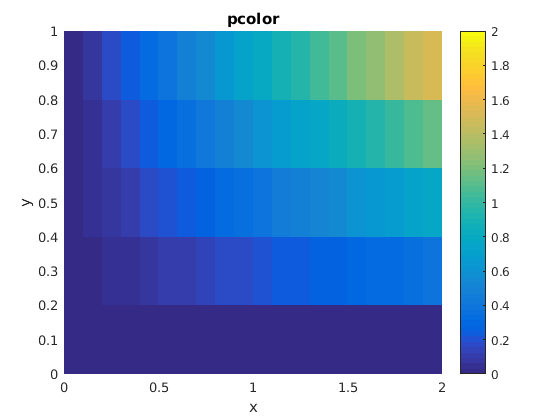
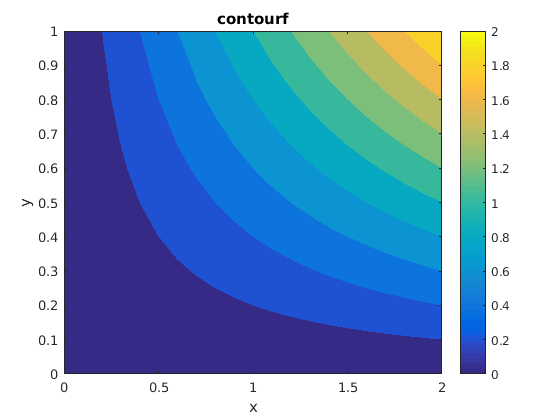
在绘制二维谱图的过程中,默认的设置会覆盖掉X,Y轴的刻度点,要使其显示出来,可以使用以下设置。
set(gca,'Layer','top');- 分段函数的快速绘制
f_test=@(x)( (x<=1)*0 + (x>1&x<2).*(x+2) + (x>=0)*0 );
x_test=0:0.1:5;
y_test=f_test(x_test);
figure();
plot(x_test,y_test);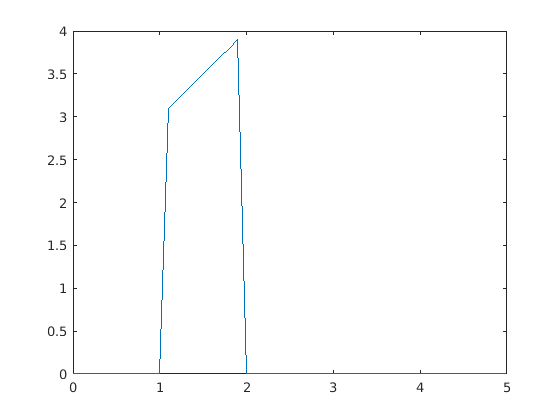
给坐标添加文字注释[3]
text(x0,y0,'text');
这种方式是针对axis对象进行的注释因而可以在subplot中方便地使用,而annotation则是针对fiugure进行的注释,因而在subplot中的使用多有不便。Matlab 图形对象
gca: 获得当前axes对象
gcf: 获得当前figure对象- 图中添加文本注释[4]
% test colorbar position
clear all;close all;clc;
x=linspace(3,5,200);
y=sin(x);
% text annotation to a specific data point
fig1=figure();
x0=3:0.01:4;
y0=cos(x0);
plot(x0,y0,'-*');
text(x0(50),y0(50),'test','Color','red');
% text annotation to a relative position on figure
figure();
fig1=subplot(2,1,1);
plot(x,sin(2*pi*90*x));
set(gca,'fontsize',15,'linewidth',1.5);
text1=annotation('TextBox',[0.2,0.8,0.05,0.05],'String','(a)','FontSize',15,'Color','blue','EdgeColor','none');
fig2=subplot(2,1,2);
set(gca,'fontsize',15,'linewidth',1.5);
ax2=plot(x,x);
text2=annotation('TextBox',[0.2,0.4,0.05,0.05],'String','(b)','FontSize',15,'Color','red','EdgeColor','none');- 设定subplot子图和colorbar的位置
可以通过控制每个字图的位置得到比较紧凑的绘图效果,这个主要是通过控制图形对象的位置来实现。
% test colorbar position
clear all;close all;clc;
x=linspace(0,1,100);
y=sin(x);
figure();
fig1=subplot(2,1,1);
plot(x,y);
bar1=colorbar();
% hide the value tick on colorbar
set(bar1,'XTickLabel',[]);
legend('sub1');
fig2=subplot(2,1,2);
plot(x,x);
legend('sub2');
% fig.position=[x0,y0,dx,dy]
fig1.Position=[0,0.5,0.5,0.5];
bar1.Position=[0.5,0.5,0.2,0.5];
fig2.Position=[0.5,0,0.5,0.5];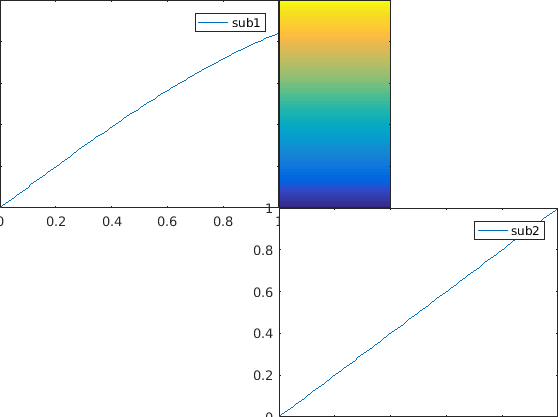
- remove xtick label
sub=subplot(3,1,1)
plot(x,y);
set(sub,'XTickLabel',[]);- 定制自己的colormap
% custom my colormap for spectrum display
mymap=zeros(7,3);
mymap(7,:)=[139,000,000];% dark red
mymap(6,:)=[255,000,000];% red
mymap(5,:)=[255,127,000];% orange
mymap(4,:)=[255,255,000];% yellow
mymap(3,:)=[000,255,000];% green
% mymap(3,:)=[000,255,255];% cyan 青色
mymap(2,:)=[000,000,255];% blue
mymap(1,:)=[255,255,255];% white
% normalize the color map RGB values to within [0,1]
mymap=mymap/255;
经过这样的定制之后,既可以在绘图时直接使用这个colormap了,在绘制二维图时调用的语法是colormap(mymap),注意colormap的顺序也是按照数组中从上到下的的顺序排列的。当然还可以利用二维插值,把colormap的颜色加密后使用。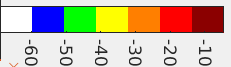
补充:matlab default color names and related RGB values
Black        0  0  0 黑
Blue         0  0  1 蓝
Cyan        0  1  1 青
Green      0  1  0 绿
Magenta  1  0  1 紫红
Red         1  0  0 红
White      1  1  1 白
Yellow     1  1  0 黄
在subplot中对不同的子图设置不同的colormap和colorbar,这里的操作只适合于新版的matlab(2015R之后)。在新版的matlab中可以在每个子图里使用set(gca,colormap_n)来控制对应的colormap,而colorbar则会随着colormap的不同而自动调整。
- 更改x,y Ticks的颜色
set(gca,'xcolor','red','ycolor','green');- 避免subplot中坐标轴标号重叠 (Axis Tick label overlap)
这个没有什么灵丹妙药,最有效的方式是通过手工调整ylim的范围,通过合适的选择可以避免上下两个子图y坐标标号的重叠。
sub(1).YLim=[y1,y2];
sub(2).YAxis(1).Limits=[z11,z12];
sub(2).YAixs(2).Limits=[z21,z22];
以上,sub(1)是单轴的子图,sub(2)是双轴的子图。
- 控制线条的颜色,格式和粗细大小[5]
figure()
plot(x,y,'--green');
plot(x2,y2,'color',[1,0,0],'LineStyle','--');
matlab可直接调用的颜色名称如前colormap的附录,对于其他颜色,可以通过归一化的RGB参数来调用。可直接调用的线条格式如下:
% line styles
'-'     Solid line (default)
'--'    Dashed line
':' Dotted line
'-.'    Dash-dot line
% line marker styles
 '+'    Plus sign
'o' Circle
'*' Asterisk
'.' Point
'x' Cross
'square' or 's'         Square
'diamond' or 'd'      Diamond
'^' Upward-pointing triangle
'v'     Downward-pointing triangle
'>' Right-pointing triangle
'<' Left-pointing triangle
'pentagram' or 'p'     Five-pointed star (pentagram)
'hexagram' or 'h'      Six-pointed star (hexagram)
控制marker的大小以及填充颜色
plot(f_TAE_eqs,f_exp_eqs,'o blue','MarkerSize',9,'MarkerFaceColor','blue');- 插入箭头注释
% add an arrow in figure
hold on
Ar1= annotation('arrow');
Ar1.X=[0.37,0.65];
Ar1.Y=[0.42,0.48];
Ar1.LineWidth=2;
Ar1.LineStyle='--';
Ar1.Color='red';
上面的代码控制了箭头注释在整个fig图中的相对位置。
- 控制坐标轴刻度线的长短和粗细
% change TickLength of current axis, former is minor TickLength, later is major TickLength
set(gca,'TickLength',[0.03,0.06]);
% change the Tick width of current axis
set(gca,'LineWidth',1.5);- 控制图形边框的有无
可以通过box参数简单地控制图形边框的显示与否[6]
% show figure black border
set(gca,'box','on');
% hide figure black border
set(gca,'box','off');- 控制colorbar的显示范围
在图中可以类似于xlim,ylim一样用caxis([low,high])来手工设定。 - 图中添加高亮透明色块[7][8]
hold on
ha = area([51, 164],[30,30],'FaceColor','red','FaceAlpha',0.1,'Edgecolor','none');
其中area的前两个参数[x1,x2],[y1,y2]确定了色块在图中的位置,而FaceColor确定了颜色的类型,而FaceAlpha则确定了色块的透明度,Edgecolor则确定了色块边框的颜色。
- 添加垂直的竖线
t2=3.3;
t3=4.8;
hold on
line([t3,t2],[0,100],'Color',c3,'LineStyle','-.','LineWidth',2);
这个可以用line函数简单地实现,第一组参数是x轴坐标,第二组参数是y轴范围。当然如果你不怕麻烦,也可以自己写出需要的数列,直接用plot来完成。
- 论文中contour图colormap范围的调节技巧
要让两幅图实现类似的色彩效果,首先要调节colorbar的底色,等到最低的背景色基本相同的时候,再调节最强幅度对应的颜色,这样两幅图的风格比较类似了。 - 格点线(grid on)的设置
% test grid line style control
clear all;close all;clc;
x=0:100;
y=sin(0.1*x);
figure('Position',[0,0,600,500]);
plot(x,y);
xlabel('x');
ylabel('y');
title('test grid style');
grid on;
set(gca,'FontSize',15,'Linewidth',1.5);
set(gca,'XMinorTick','on','YMinorTick','on');% control on/off of minor grids
set(gca, 'xminorgrid', 'on','YMinorGrid','on');% control on/off of minor grid lines
set(gca,'MinorGridLineStyle',':');% set minor grid line style
set(gca,'GridLineStyle','--');% set major grid line style
set(gca,'GridAlpha',0.3);% set grid line transparence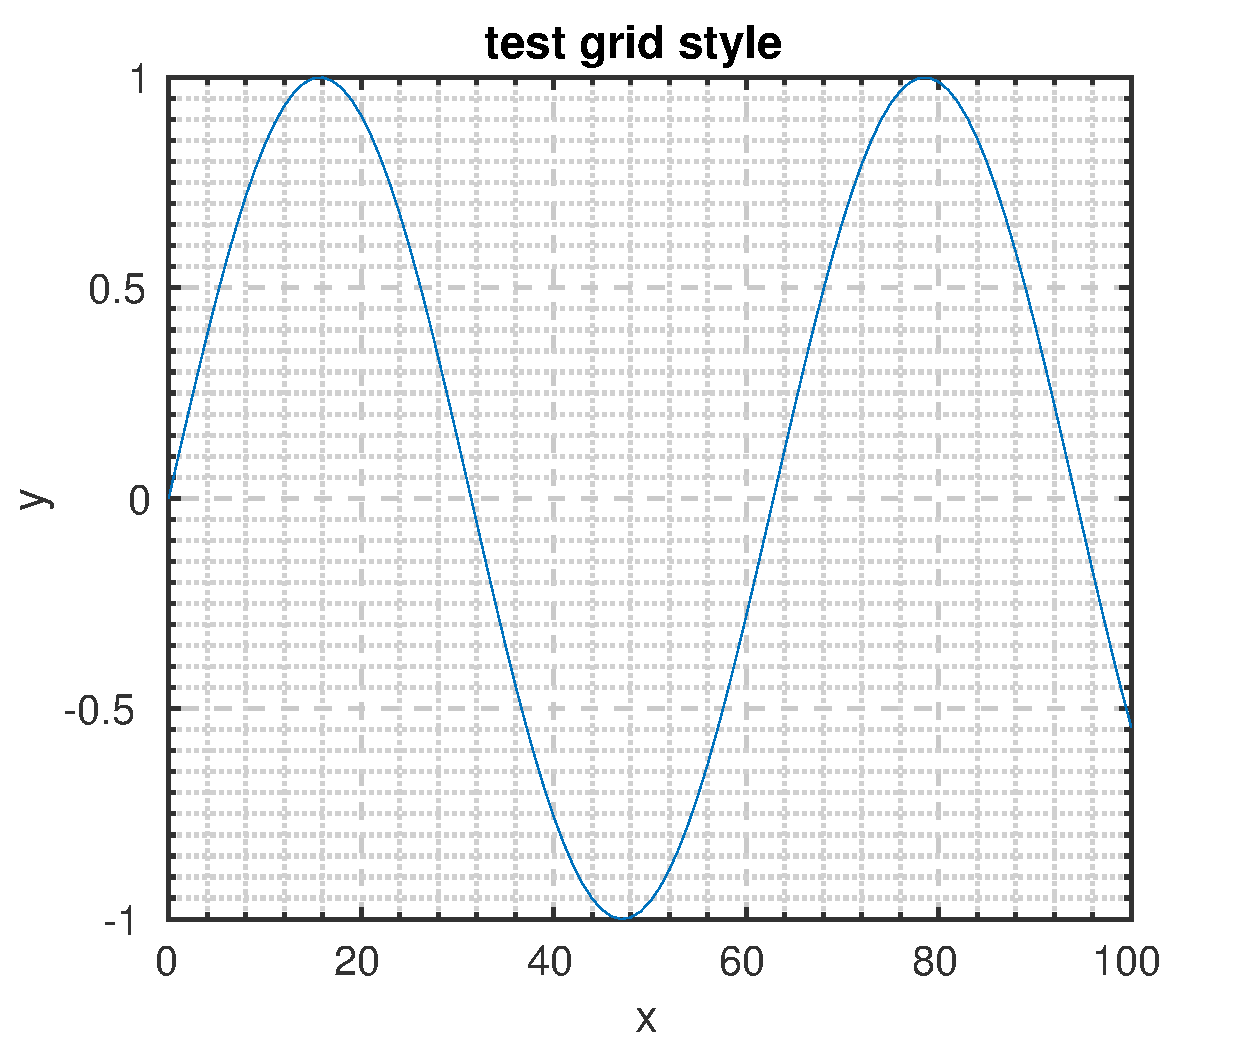
参考:
[1]https://cn.mathworks.com/matlabcentral/answers/279106-how-to-set-y-axis-as-log-scale
[2]https://stackoverflow.com/questions/23322565/plot-a-peak-with-height
[3]https://cn.mathworks.com/help/matlab/creating_plots/add-text-to-specific-points-on-graph.html
[4]https://stackoverflow.com/questions/14262354/textbox-in-matlab-plot
[5]https://cn.mathworks.com/help/matlab/ref/linespec.html
[6]https://stackoverflow.com/questions/9166786/remove-border-around-matlab-plot
[7]https://stackoverflow.com/questions/4698679/shading-between-vertical-lines-in-matlab
[8]https://cn.mathworks.com/help/matlab/ref/area.html