qcustomplot 绘制 频谱图 瀑布图,游标实现跟随曲线数据的实时展示_spectrumdisplay-程序员宅基地
技术标签: 界面开发
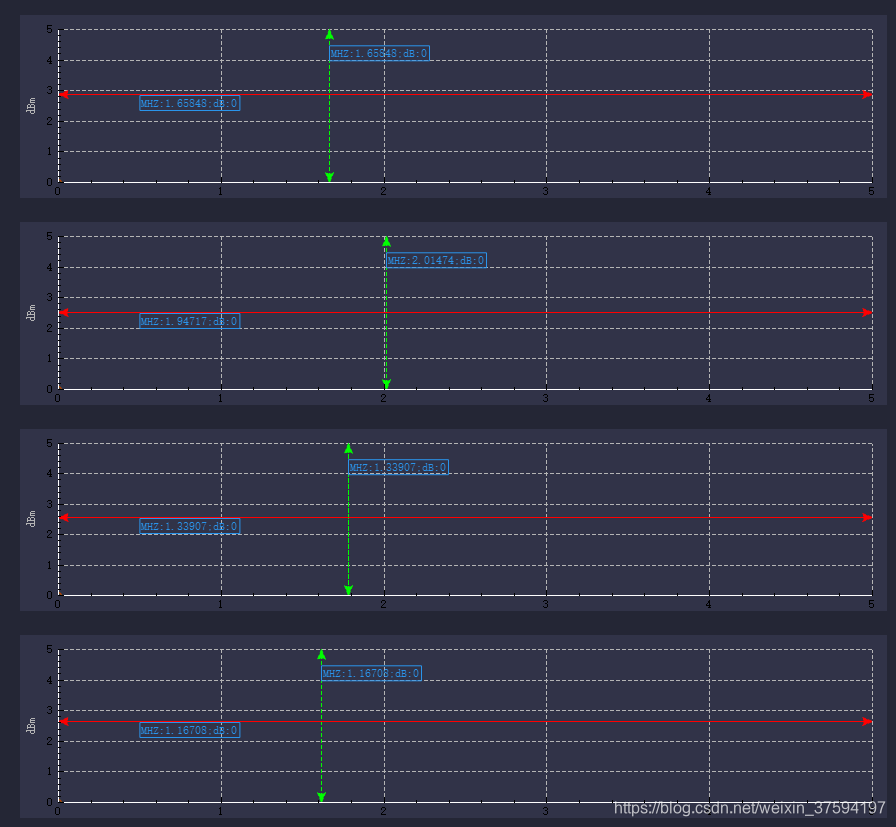
qcustomplot 绘制 频谱图 瀑布图,游标实现跟随曲线数据的实时展示
文件结构
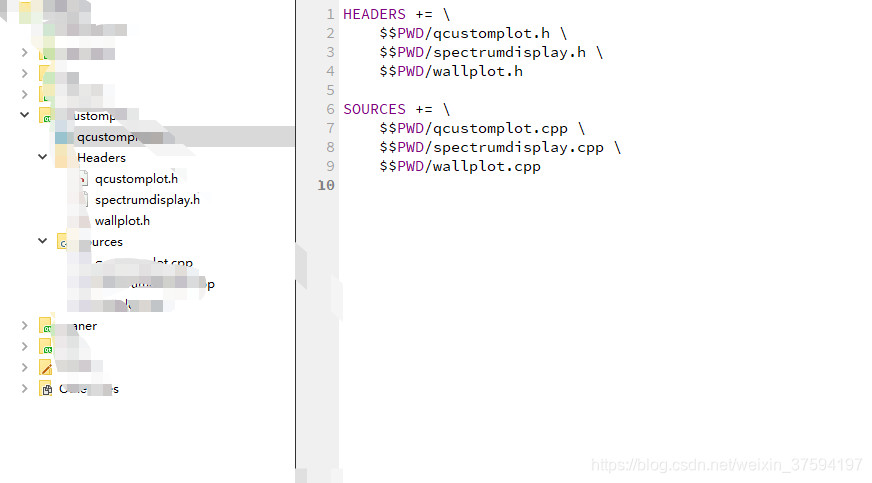
pri文件结构
重写qcustomplot
#ifndef SPECTRUMDISPLAY_H
#define SPECTRUMDISPLAY_H
#include
#include
#include<qpainter.h>
#include
#include<qcustomplot/qcustomplot.h>
#include
#include
class SpectrumDisplay : public QCustomPlot
{
Q_OBJECT
public:
explicit SpectrumDisplay(QWidget *parent = nullptr);
//QCustomPlot *customplot;
QCPItemText *textLabel;
QCPItemTracer *tracer_h;
QCPItemText *textLabel2;
QCPItemRect *rect;//目标迹点矩形追踪
QQueue<QVector> appitlude_fre;
enum direction //创建垂直和水平迹线
{
vertical = 1 ,
horiental = 2,
};
QPointF pos;
QPointF pos2;
void setXaxisx(double xmin,double xmax);//设置X轴范围
void setYaxisy(double ymin,double ymax);//设置y轴范围
void drawCurse(direction);//设置游标
void setPlotStyle();
void setdata(QVector freq,QVectorappitude,QColor color);
void TargetTraceRectangleTracking(QVector,QVector);
void drawDataEnvelop(QVector freq,QVectorappitude,QColor color);
void EnableBackgroundZoom(bool);//启用自由缩放
void EnableOpengl(bool);
virtual void paintEvent(QPaintEvent *);
virtual void mouseMoveEvent(QMouseEvent *event);
signals:
public slots:
};
#endif // SPECTRUMDISPLAY_H
绘制游标
void SpectrumDisplay:: drawCurse(direction dir)//设置游标
{
if(dir == vertical )
{
/绘制游标直线**********/
QCPItemStraightLine line= new QCPItemStraightLine (this);
QPen linesPen(Qt::green, 1, Qt::DashLine);
line->setPen(linesPen);
line->setClipToAxisRect(true);
line->point1->setCoords(0,0);
line->point2->setCoords(0,0);
line->setVisible(false);
/绘制游标箭头**********/
QCPItemLine arrow = new QCPItemLine(this);
arrow->start->setParentAnchor(line->point1);
arrow->end->setCoords(0, 0); //设置直线终点为坐标系中的点
arrow->setHead(QCPLineEnding::esSpikeArrow);//设置箭头类型(三角形、菱形、方形等)
arrow->setPen(linesPen);
arrow->setVisible(false);
QCPItemLine arrow2 = new QCPItemLine(this);
arrow2->start->setParentAnchor(line->point2);
arrow2->end->setCoords(0, 0); //设置直线终点为坐标系中的点
arrow2->setHead(QCPLineEnding::esSpikeArrow);//设置箭头类型(三角形、菱形、方形等)
arrow2->setPen(linesPen);
arrow2->setVisible(false);
/绘制游标文本******/
textLabel = new QCPItemText(this);//在QCustomplot中新建文字框
textLabel->setPositionAlignment(Qt::AlignTop|Qt::AlignLeft);//文字布局:顶、左对齐
textLabel->position->setType(QCPItemPosition::ptAxisRectRatio);//位置类型(当前轴范围的比例为单位/实际坐标为单位)
textLabel->position->setCoords(0.1, 0.1); //把文字框放在X轴的中间,Y轴的最顶部
textLabel->setText(“Text Item Demo”);
textLabel->setColor(QColor(42,148,235));
textLabel->setFont(QFont(font().family(), 8)); //字体大小
textLabel->setPen(QPen(QColor(42,148,235))); //字体颜色
textLabel->setPadding(QMargins(2,2,2,2));//文字距离边框几个像素
textLabel->setVisible(false);
/**绘制数据吸附点/
tracer_h = new QCPItemTracer(this);
tracer_h->setGraph(this->graph(0));
tracer_h->setPen(QPen(Qt::green));
tracer_h->setStyle(QCPItemTracer::tsCircle);
connect(this, &QCustomPlot::mouseMove,this,[=](QMouseEvent *event)
{
double x = this->xAxis->pixelToCoord(event->pos().x());
double y = this->yAxis->pixelToCoord(event->pos().y());
pos= QPointF(x,y);
if(event->buttons() == Qt::LeftButton)
{
tracer_h->setGraphKey(x);
tracer_h->updatePosition();
line->point1->setCoords(x,this->yAxis->range().lower);
line->point2->setCoords(x,this->yAxis->range().upper);
line->setVisible(true);
arrow->start->setParentAnchor(line->point1);
arrow->end->setCoords(x,this->yAxis->range().upper);
arrow->setVisible(true);
arrow2->start->setParentAnchor(line->point2);
arrow2->end->setCoords(x,this->yAxis->range().lower);
arrow2->setVisible(true);
textLabel->position->setCoords(x/this->xAxis->range().upper,0.1);
textLabel->setVisible(true);
this->replot();
}
    });
}
if(dir == horiental)
{
    QCPItemStraightLine *line = new  QCPItemStraightLine (this);
    QPen linesPen(Qt::red, 1, Qt::DashLine);
    line->setPen(linesPen);
    line->setClipToAxisRect(true);
    line->point1->setCoords(0,0);
    line->point2->setCoords(0,0);
    line->setVisible(false);
    QCPItemLine *arrow = new QCPItemLine(this);
    arrow->start->setParentAnchor(line->point1);  //设置该直线的起点为文字框的下锚点
    arrow->end->setCoords(0, 0); //设置直线终点为坐标系中的点
    arrow->setHead(QCPLineEnding::esSpikeArrow);//设置箭头类型(三角形、菱形、方形等)
    arrow->setPen(linesPen);
    arrow->setVisible(false);
    QCPItemLine *arrow2 = new QCPItemLine(this);
    arrow2->start->setParentAnchor(line->point2);  //设置该直线的起点为文字框的下锚点
    arrow2->end->setCoords(0, 0); //设置直线终点为坐标系中的点
    arrow2->setHead(QCPLineEnding::esSpikeArrow);//设置箭头类型(三角形、菱形、方形等)
    arrow2->setPen(linesPen);
    arrow2->setVisible(false);
    textLabel2 = new QCPItemText(this);//在QCustomplot中新建文字框
    textLabel2->setPositionAlignment(Qt::AlignTop|Qt::AlignLeft);//文字布局:顶、左对齐
    textLabel2->position->setType(QCPItemPosition::ptAxisRectRatio);//位置类型(当前轴范围的比例为单位/实际坐标为单位)
    textLabel2->position->setCoords(0.1, 0.1); //把文字框放在X轴的中间,Y轴的最顶部
    textLabel2->setText("Text Item Demo");
    textLabel2->setFont(QFont(font().family(), 8)); //字体大小
    textLabel2->setPen(QPen(QColor(42,148,235))); //字体颜色
    textLabel2->setColor(QColor(42,148,235));
    textLabel2->setPadding(QMargins(2,2,2,2));//文字距离边框几个像素
    textLabel2->setVisible(false);
    QCPItemTracer *tracer_h = new QCPItemTracer(this);
    tracer_h->setGraph(this->graph(0));
    tracer_h->setPen(QPen(Qt::red));
    tracer_h->setStyle(QCPItemTracer::tsCircle);
    connect(this, &QCustomPlot::mouseMove,this,[=](QMouseEvent *event)
    {
        if(event->buttons() == Qt::RightButton)
        {
            double x = this->xAxis->pixelToCoord(event->pos().x());
            double y = this->yAxis->pixelToCoord(event->pos().y());
            pos2= QPointF(x,y);
            tracer_h->setGraphKey(x);
            tracer_h->updatePosition();
            line->point1->setCoords(this->xAxis->range().lower,y);
            line->point2->setCoords(this->xAxis->range().upper,y);
            line->setVisible(true);
            arrow->start->setParentAnchor(line->point1);  //设置该直线的起点为文字框的下锚点
            arrow->end->setCoords(this->xAxis->range().upper,y); //设置直线终点为坐标系中的点
            arrow->setVisible(true);
            arrow2->start->setParentAnchor(line->point2);  //设置该直线的起点为文字框的下锚点
            arrow2->end->setCoords(this->xAxis->range().lower,y); //设置直线终点为坐标系中的点
            arrow2->setVisible(true);
            textLabel2->position->setCoords(0.1,(1-y/this->yAxis->range().upper));
            textLabel2->setVisible(true);
            this->replot();
        }
    });
}
}
paintevent重载实现实时显示跟随的点
void SpectrumDisplay:: paintEvent(QPaintEvent *ev)
{
QCustomPlot::paintEvent(ev);
if(textLabel!=nullptr)
textLabel->setText(“MHZ:”+QString::number(pos.x())+";dB:"+QString::number(tracer_h->position->value()));
if(textLabel2!=nullptr)
textLabel2->setText(“MHZ:”+QString::number(pos2.x())+";dB:"+QString::number(tracer_h->position->value()));
//    QPainter pen(this);
//    pen.setRenderHint(QPainter::Antialiasing, true);
//    pen.setPen(Qt::yellow);
//    QRect a;
//    double w= this->width();
//    double h = this->height();
//    pen.drawRect(1,1,w/2,h/2);
}
/**
- @brief SpectrumDisplay::TargetTraceRectangleTracking
- @param data 绘制矩形追踪标识
- @param sentce
*/
void SpectrumDisplay:: TargetTraceRectangleTracking(QVector data,QVectorsentce)
{
for(int i =0;i<=sentce.count()-1;i++)
{
rect = new QCPItemRect(this);
rect->topLeft->setCoords(data[sentce[i].x()].x(),data[sentce[i].y()].y()+30);
rect->bottomRight->setCoords(data[sentce[i].y()].x(), data[sentce[i].y()].y()-20);
rect->setPen(QPen(QColor(0,161,214)));
}
}
void SpectrumDisplay:: drawDataEnvelop(QVector freq,QVectorappitude,QColor color)
{
appitlude_fre<<appitude;
static int z =0;
z++;
if(z>200)
{
appitlude_fre.clear();
z=0;
}
QVector maxapplitude(freq.length());
for(int i = 0;i<appitude.length();i++)
{
if(appitlude_fre.length()<2)
{
/增加一条曲线绘制包络**********/
}else
{
for(int j = 0;j<appitude.length();j++)
{
if(appitude[j]<appitlude_fre[0][j])
{
appitude[j] = appitlude_fre[0][j];
            }else {

            }
        }
        appitlude_fre.dequeue();
    }
}


this->addGraph();
this->graph(1);
this->graph(1)->setData(freq,appitude);
this->graph(1)->setPen(QPen( color));
}
void SpectrumDisplay:: mouseMoveEvent(QMouseEvent *event)
{
QCustomPlot::mouseMoveEvent(event);
}
绘制瀑布图
void wallplot:: SetWaterFallParm(double xmin,double xmax,double dBmin,double dBmax)
{
//this->setInteractions(QCP::iRangeDrag|QCP::iRangeZoom| QCP::iSelectPlottables);//可拖拽+可滚轮缩放


//每条曲线都会独占一个graph()


//通过传递的轴的QCustomPlot进行注册,简洁理解QCPColorMap的数据为(x轴,y轴;颜色,值value)
m_pColorMap = new QCPColorMap(this->xAxis,this->yAxis);
m_pColorMap->data()->setSize(1000,3000);//设置整个图(x,y)点数,X轴50个点,y轴4096个点
this->xAxis->setRange(xmin,xmax);//当前X轴显示范围
this->yAxis->setRange(-150,20);//当前y轴显示范围
m_pColorMap->data()->setRange(QCPRange(xmin,xmax),QCPRange(dBmin,dBmax));//setRange是设置X轴以及Y轴的范围
m_pColorMap->setGradient(QCPColorGradient::gpCold);//设置默认渐进色变化(可在QCPColorGradient中查看)
m_pColorMap->rescaleDataRange(true);
}
void wallplot:: setData(QVectordatax,QVectordatay)
{
static QList<QVector> data;
data<<datay;
if(data.length()>4)
{
data.removeLast();
}
this->addGraph();
this->graph(0)->setPen(QPen(Qt::gray));//曲线颜色
this->graph(0)->setBrush(QBrush(QColor(0,255,255,20)));//曲线与X轴包围区的颜色
//自动调整XY轴的范围,以便显示出graph(0)中所有的点
//给第一个graph设置rescaleAxes(),后续所有graph都设置rescaleAxes(true)即可实现显示所有曲线
this->graph(0)->rescaleAxes();
for(int x=0;x<datax.length();x++)
{
    for(int j=0;j<data.length();j++)
    {
        for(int y=0;y<data[j].length();y++)
        {
            m_pColorMap->data()->setCell(x,y*j+y,data[j][y]);
        }
    }
}
this->replot();
}
这里就没加测试数据了,需要完整demo的可以私信我。
智能推荐
攻防世界_难度8_happy_puzzle_攻防世界困难模式攻略图文-程序员宅基地
文章浏览阅读645次。这个肯定是末尾的IDAT了,因为IDAT必须要满了才会开始一下个IDAT,这个明显就是末尾的IDAT了。,对应下面的create_head()代码。,对应下面的create_tail()代码。不要考虑爆破,我已经试了一下,太多情况了。题目来源:UNCTF。_攻防世界困难模式攻略图文
达梦数据库的导出(备份)、导入_达梦数据库导入导出-程序员宅基地
文章浏览阅读2.9k次,点赞3次,收藏10次。偶尔会用到,记录、分享。1. 数据库导出1.1 切换到dmdba用户su - dmdba1.2 进入达梦数据库安装路径的bin目录,执行导库操作 导出语句:./dexp cwy_init/[email protected]:5236 file=cwy_init.dmp log=cwy_init_exp.log 注释: cwy_init/init_123..._达梦数据库导入导出
js引入kindeditor富文本编辑器的使用_kindeditor.js-程序员宅基地
文章浏览阅读1.9k次。1. 在官网上下载KindEditor文件,可以删掉不需要要到的jsp,asp,asp.net和php文件夹。接着把文件夹放到项目文件目录下。2. 修改html文件,在页面引入js文件:<script type="text/javascript" src="./kindeditor/kindeditor-all.js"></script><script type="text/javascript" src="./kindeditor/lang/zh-CN.js"_kindeditor.js
STM32学习过程记录11——基于STM32G431CBU6硬件SPI+DMA的高效WS2812B控制方法-程序员宅基地
文章浏览阅读2.3k次,点赞6次,收藏14次。SPI的详情简介不必赘述。假设我们通过SPI发送0xAA,我们的数据线就会变为10101010,通过修改不同的内容,即可修改SPI中0和1的持续时间。比如0xF0即为前半周期为高电平,后半周期为低电平的状态。在SPI的通信模式中,CPHA配置会影响该实验,下图展示了不同采样位置的SPI时序图[1]。CPOL = 0,CPHA = 1:CLK空闲状态 = 低电平,数据在下降沿采样,并在上升沿移出CPOL = 0,CPHA = 0:CLK空闲状态 = 低电平,数据在上升沿采样,并在下降沿移出。_stm32g431cbu6
计算机网络-数据链路层_接收方收到链路层数据后,使用crc检验后,余数为0,说明链路层的传输时可靠传输-程序员宅基地
文章浏览阅读1.2k次,点赞2次,收藏8次。数据链路层习题自测问题1.数据链路(即逻辑链路)与链路(即物理链路)有何区别?“电路接通了”与”数据链路接通了”的区别何在?2.数据链路层中的链路控制包括哪些功能?试讨论数据链路层做成可靠的链路层有哪些优点和缺点。3.网络适配器的作用是什么?网络适配器工作在哪一层?4.数据链路层的三个基本问题(帧定界、透明传输和差错检测)为什么都必须加以解决?5.如果在数据链路层不进行帧定界,会发生什么问题?6.PPP协议的主要特点是什么?为什么PPP不使用帧的编号?PPP适用于什么情况?为什么PPP协议不_接收方收到链路层数据后,使用crc检验后,余数为0,说明链路层的传输时可靠传输
软件测试工程师移民加拿大_无证移民,未受过软件工程师的教育(第1部分)-程序员宅基地
文章浏览阅读587次。软件测试工程师移民加拿大 无证移民,未受过软件工程师的教育(第1部分) (Undocumented Immigrant With No Education to Software Engineer(Part 1))Before I start, I want you to please bear with me on the way I write, I have very little gen...
随便推点
Thinkpad X250 secure boot failed 启动失败问题解决_安装完系统提示secureboot failure-程序员宅基地
文章浏览阅读304次。Thinkpad X250笔记本电脑,装的是FreeBSD,进入BIOS修改虚拟化配置(其后可能是误设置了安全开机),保存退出后系统无法启动,显示:secure boot failed ,把自己惊出一身冷汗,因为这台笔记本刚好还没开始做备份.....根据错误提示,到bios里面去找相关配置,在Security里面找到了Secure Boot选项,发现果然被设置为Enabled,将其修改为Disabled ,再开机,终于正常启动了。_安装完系统提示secureboot failure
C++如何做字符串分割(5种方法)_c++ 字符串分割-程序员宅基地
文章浏览阅读10w+次,点赞93次,收藏352次。1、用strtok函数进行字符串分割原型: char *strtok(char *str, const char *delim);功能:分解字符串为一组字符串。参数说明:str为要分解的字符串,delim为分隔符字符串。返回值:从str开头开始的一个个被分割的串。当没有被分割的串时则返回NULL。其它:strtok函数线程不安全,可以使用strtok_r替代。示例://借助strtok实现split#include <string.h>#include <stdio.h&_c++ 字符串分割
2013第四届蓝桥杯 C/C++本科A组 真题答案解析_2013年第四届c a组蓝桥杯省赛真题解答-程序员宅基地
文章浏览阅读2.3k次。1 .高斯日记 大数学家高斯有个好习惯:无论如何都要记日记。他的日记有个与众不同的地方,他从不注明年月日,而是用一个整数代替,比如:4210后来人们知道,那个整数就是日期,它表示那一天是高斯出生后的第几天。这或许也是个好习惯,它时时刻刻提醒着主人:日子又过去一天,还有多少时光可以用于浪费呢?高斯出生于:1777年4月30日。在高斯发现的一个重要定理的日记_2013年第四届c a组蓝桥杯省赛真题解答
基于供需算法优化的核极限学习机(KELM)分类算法-程序员宅基地
文章浏览阅读851次,点赞17次,收藏22次。摘要:本文利用供需算法对核极限学习机(KELM)进行优化,并用于分类。
metasploitable2渗透测试_metasploitable2怎么进入-程序员宅基地
文章浏览阅读1.1k次。一、系统弱密码登录1、在kali上执行命令行telnet 192.168.26.1292、Login和password都输入msfadmin3、登录成功,进入系统4、测试如下:二、MySQL弱密码登录:1、在kali上执行mysql –h 192.168.26.129 –u root2、登录成功,进入MySQL系统3、测试效果:三、PostgreSQL弱密码登录1、在Kali上执行psql -h 192.168.26.129 –U post..._metasploitable2怎么进入
Python学习之路:从入门到精通的指南_python人工智能开发从入门到精通pdf-程序员宅基地
文章浏览阅读257次。本文将为初学者提供Python学习的详细指南,从Python的历史、基础语法和数据类型到面向对象编程、模块和库的使用。通过本文,您将能够掌握Python编程的核心概念,为今后的编程学习和实践打下坚实基础。_python人工智能开发从入门到精通pdf