Linux tracepoint 简介-程序员宅基地
技术标签: c语言 linux Linux 调试及其原理 服务器
前言
跟踪点是放置在内核代码中较重要位置的硬编码检测点。例如,在系统调用、调度程序事件、文件系统操作和磁盘I/O的开始和结束处都有跟踪点。跟踪点基础设施由Mathieu Desnoyers开发,并于2009年在Linux 2.6.32版本中首次提供。跟踪点是一个稳定的API,数量有限。
跟踪点是性能分析的重要资源,因为它们为高级跟踪工具提供了强大的支持,超越了摘要统计,提供了对内核行为的深入了解。虽然基于功能的跟踪可以提供类似的功能(例如,kprobes),但只有跟踪点提供稳定的接口,允许开发健壮的工具。
一、跟踪点的目的
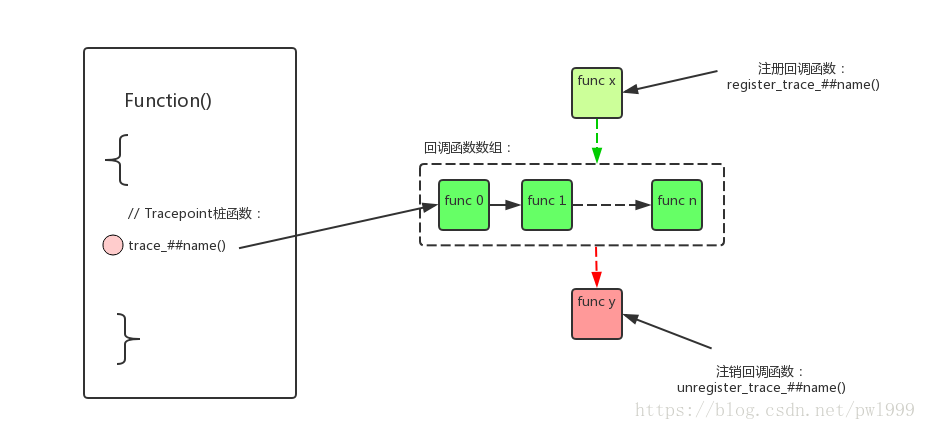
tracepoint是内核预先定义的静态探测点,是一种静态插桩方法,可以用于挂载钩子(hook)函数来做trace,放置在代码中的跟踪点提供了一个钩子(hook)来调用您可以在运行时提供的函数(probe,可以是多个probe,probe函数原型要与跟踪点函数原型一致)。跟踪点可以是“on”(一个 probe连接到跟踪点)或“off”(没有 probe 附加到跟踪点上)。当跟踪点“关闭”时,除了添加一个微小的时间惩罚(检查分支的条件)和空间惩罚(在插入指令的函数末尾为函数调用添加几个字节,并在单独的部分中添加一个数据结构)之外,它没有任何其它影响。当跟踪点为“on”时,每次在调用方的执行上下文中执行跟踪点时都会调用您提供的函数。当提供的函数结束其执行时,它返回到调用者(从 tracepoint site 继续)。
可以在代码中的重要位置放置跟踪点。它们是轻量级钩子,可以传递任意数量的参数,原型在放置在头文件中的跟踪点声明中描述。
当系统执行到 tracepoint 点时,会执行 tracepoint 上的我们注册的 probe 函数(可以注册多个 probe 函数),类似于printk,输出当前 tracepoint 上下文的环境信息,只是不是输出到终端,而是 ring buffer,这样我们在用户层通过debugfs(tracefs)接口就可以读取 ring buffer 中的信息,了解到内核中当前运行的状态。
tracepoints可以用于跟踪和性能计数。跟踪点表示内核中使用的一些重要事件,构建系统内正在发生的事情的“全貌”。跟踪点是内核源代码中的一个标记,当启用它时,可以用来在标记所在的点处挂钩到正在运行的内核。它们可由许多工具用于内核调试和性能问题诊断。
二、跟踪点的使用
跟踪点需要两个元素:
头文件中存放跟踪点语句(为了使用跟踪点,应该包括linux/tracepoint.h。)。
In include/trace/events/subsys.h:
#undef TRACE_SYSTEM
#define TRACE_SYSTEM subsys

#if !defined(_TRACE_SUBSYS_H) || defined(TRACE_HEADER_MULTI_READ)
#define _TRACE_SUBSYS_H

#include <linux/tracepoint.h>

//声明跟踪点:subsys_eventname
DECLARE_TRACE(subsys_eventname,
        TP_PROTO(int firstarg, struct task_struct *p),
        TP_ARGS(firstarg, p));

#endif /* _TRACE_SUBSYS_H */

/* This part must be outside protection */
#include <trace/define_trace.h>
c文件中跟踪点的声明。
In subsys/file.c (其中必须添加跟踪语句):
#include <trace/events/subsys.h>

#define CREATE_TRACE_POINTS
//定义跟踪点:subsys_eventname
DEFINE_TRACE(subsys_eventname);

void somefct(void)
{

        ...
        trace_subsys_eventname(arg, task);
        ...
}
(1)
subsys_eventname是事件的唯一标识符:
subsys是子系统的名称。
eventname是要跟踪的事件的名称。
会在 tracing/event/目录下产生: tracing/event/subsys/subsys_eventname/ 这样一个跟踪点目录。
(2)
TP_PROTO(int firstarg,struct task_struct*p)是此跟踪点调用的函数的原型。
TP_ARGS(firstarg,p)是与原型中相同的参数名称。
(3)
如果在多个源文件中使用 the header ,#define CREATE_TRACE_POINTS应该只出现在一个源文件中。
通过register_trace_subsys_eventname()为特定跟踪点提供 probe(要调用的函数),可以将函数(probe)连接到跟踪点。通过unregister_trace_subsys_eventname()删除probe;它将移除probe。必须在模块退出函数结束之前调用tracepoint_synchronize_unregister(),以确保没有使用 probe 的调用者。这一点,以及在探测调用周围禁用抢占的事实,确保探测移除和模块卸载是安全的。
跟踪点机制支持插入同一跟踪点的多个实例,但必须在所有内核上对给定的跟踪点名称进行单个定义,以确保不会发生类型冲突。使用原型对跟踪点进行名称修改,以确保类型正确。编译器在注册站点验证探针类型的正确性。跟踪点可以放在内联函数、内联静态函数、展开循环以及常规函数中。
这里建议使用命名方案“subsys_event”作为限制冲突的约定。跟踪点名称对内核是全局的:无论是在核心内核映像中还是在模块中,它们都被认为是相同的。
如果必须在内核模块中使用跟踪点,则可以使用EXPORT_TRACEPOINT_SYMBOL_GPL()或EXPORT_TRACEPOINT_SYMBOL()导出定义的跟踪点。
#define EXPORT_TRACEPOINT_SYMBOL_GPL(name)				\
	EXPORT_SYMBOL_GPL(__tracepoint_##name)
#define EXPORT_TRACEPOINT_SYMBOL(name)					\
	EXPORT_SYMBOL(__tracepoint_##name)
如果您需要为跟踪点参数做一些工作,并且该工作仅用于跟踪点,则可以使用以下语句将该工作封装在 If 语句中:
if (trace_foo_bar_enabled()) {

        int i;
        int tot = 0;

        for (i = 0; i < count; i++)
                tot += calculate_nuggets();

        trace_foo_bar(tot);
}
所有trace_tracepoint()调用都定义了一个匹配的trace_tracepoint_enabled()函数,如果启用了跟踪点,则返回true,否则返回false。trace_tracepoint()应该始终位于if(trace_trackpoint_enabled())的块内,以防止启用的跟踪点和看到的检查之间的竞争。
使用trace_tracepoint_enabled()的优点是它使用跟踪点的static_key来允许使用跳转标签实现if语句,并避免条件分支。
如果需要从头文件中调用跟踪点,建议不要直接调用跟踪点或使用trace_tracepoint_enabled()函数调用,因为如果头文件中包含的头文件设置了CREATE_TRACE_POINTS ,则头文件中的跟踪点可能会产生副作用,此外,trace_tracepoint()在内联函数中并没有那么小,如果被其他内联函数使用,可能会导致内核膨胀。取而代之的是,包括tracepoint-defs.h并使用tracepoint_Enable()。
In a C file:
void do_trace_foo_bar_wrapper(args)
{

        trace_foo_bar(args);
}
In the header file:
DECLARE_TRACEPOINT(foo_bar);

static inline void some_inline_function()
{

        [..]
        if (tracepoint_enabled(foo_bar))
                do_trace_foo_bar_wrapper(args);
        [..]
}
三、DECLARE_TRACE
DECLARE_TRACE宏主要用来声明 struct tracepoint 结构体 ,定义register_trace_##name函数,给 tracepoint 点注册 probe 函数。
(struct tracepoint 结构体 在 DEFINE_TRACE宏中定义)
(1)
DECLARE_TRACE()传递“proto”作为跟踪点原型,传递“void*__data,proto”为回调原型。
#define DECLARE_TRACE(name, proto, args)				\
		__DECLARE_TRACE(name, PARAMS(proto), PARAMS(args), 1,	\
				PARAMS(void *__data, proto),		\
				PARAMS(__data, args))
(2)
/*
 * Make sure the alignment of the structure in the __tracepoints section will
 * not add unwanted padding between the beginning of the section and the
 * structure. Force alignment to the same alignment as the section start.
 */
#define __DECLARE_TRACE(name, proto, args, cond, data_proto, data_args) \
	//声明 struct tracepoint 结构体
	extern struct tracepoint __tracepoint_##name;			\
	static inline void trace_##name(proto)				\
	{
    								\
		//判断tracepoint是否使能
		if (static_key_false(&__tracepoint_##name.key))		\
			__DO_TRACE(&__tracepoint_##name,		\
				TP_PROTO(data_proto),			\
				TP_ARGS(data_args),			\
				TP_CONDITION(cond),,);			\
	}								\
	__DECLARE_TRACE_RCU(name, PARAMS(proto), PARAMS(args),		\
		PARAMS(cond), PARAMS(data_proto), PARAMS(data_args))	\

	//通过register_trace_##name()为跟踪点提供 probe
	static inline int						\
	register_trace_##name(void (*probe)(data_proto), void *data)	\
	{
    								\
		return tracepoint_probe_register(#name, (void *)probe,	\
						 data);			\
	}								\

	//通过unregister_trace_##name()删除probe,移除probe
	static inline int						\
	unregister_trace_##name(void (*probe)(data_proto), void *data)	\
	{
    								\
		return tracepoint_probe_unregister(#name, (void *)probe, \
						   data);		\
	}								\
	static inline void						\
	check_trace_callback_type_##name(void (*cb)(data_proto))	\
	{
    								\
	}
// linux-3.10/kernel/tracepoint.c

/**
 * tracepoint_probe_register -  Connect a probe to a tracepoint
 * @name: tracepoint name
 * @probe: probe handler
 *
 * Returns 0 if ok, error value on error.
 * The probe address must at least be aligned on the architecture pointer size.
 */
int tracepoint_probe_register(const char *name, void *probe, void *data)
{

	struct tracepoint_func *old;

	mutex_lock(&tracepoints_mutex);
	old = tracepoint_add_probe(name, probe, data);
	if (IS_ERR(old)) {

		mutex_unlock(&tracepoints_mutex);
		return PTR_ERR(old);
	}
	tracepoint_update_probes();		/* may update entry */
	mutex_unlock(&tracepoints_mutex);
	release_probes(old);
	return 0;
}
EXPORT_SYMBOL_GPL(tracepoint_probe_register);

/**
 * tracepoint_probe_unregister -  Disconnect a probe from a tracepoint
 * @name: tracepoint name
 * @probe: probe function pointer
 *
 * We do not need to call a synchronize_sched to make sure the probes have
 * finished running before doing a module unload, because the module unload
 * itself uses stop_machine(), which insures that every preempt disabled section
 * have finished.
 */
int tracepoint_probe_unregister(const char *name, void *probe, void *data)
{

	struct tracepoint_func *old;

	mutex_lock(&tracepoints_mutex);
	old = tracepoint_remove_probe(name, probe, data);
	if (IS_ERR(old)) {

		mutex_unlock(&tracepoints_mutex);
		return PTR_ERR(old);
	}
	tracepoint_update_probes();		/* may update entry */
	mutex_unlock(&tracepoints_mutex);
	release_probes(old);
	return 0;
}
EXPORT_SYMBOL_GPL(tracepoint_probe_unregister);
struct tracepoint_func {

	void *func;
	void *data;
};

struct tracepoint {

	const char *name;		/* Tracepoint name */
	struct static_key key;
	void (*regfunc)(void);
	void (*unregfunc)(void);
	struct tracepoint_func __rcu *funcs;
};
每种Tracepoint有一个name、一个key开关、一系列桩函数。
key(static_key来允许使用跳转标签实现if语句,并避免条件分支):tracepoint是否使能的开关trace_tracepoint_enabled(),如果回调函数数组为空则key为disable,如果回调函数数组中有函数指针则key为enable。
regfunc:注册回调函数时用到的hook函数(注意:不是用来注册回调函数的,注册回调函数是register_trace_##name)。
unregfunc:注销回调函数时的的hook函数(注意:不是用来注销回调函数的,注销回调函数是unregister_trace_##name)。
/*
 * Sets the probe callback corresponding to one tracepoint.
 */
static void set_tracepoint(struct tracepoint_entry **entry,
	struct tracepoint *elem, int active)
{

	WARN_ON(strcmp((*entry)->name, elem->name) != 0);

	if (elem->regfunc && !static_key_enabled(&elem->key) && active)
		elem->regfunc();
	else if (elem->unregfunc && static_key_enabled(&elem->key) && !active)
		elem->unregfunc();

	/*
	 * rcu_assign_pointer has a smp_wmb() which makes sure that the new
	 * probe callbacks array is consistent before setting a pointer to it.
	 * This array is referenced by __DO_TRACE from
	 * include/linux/tracepoints.h. A matching smp_read_barrier_depends()
	 * is used.
	 */
	rcu_assign_pointer(elem->funcs, (*entry)->funcs);
	if (active && !static_key_enabled(&elem->key))
		static_key_slow_inc(&elem->key);
	else if (!active && static_key_enabled(&elem->key))
		static_key_slow_dec(&elem->key);
}

/*
 * Disable a tracepoint and its probe callback.
 * Note: only waiting an RCU period after setting elem->call to the empty
 * function insures that the original callback is not used anymore. This insured
 * by preempt_disable around the call site.
 */
static void disable_tracepoint(struct tracepoint *elem)
{

	if (elem->unregfunc && static_key_enabled(&elem->key))
		elem->unregfunc();

	if (static_key_enabled(&elem->key))
		static_key_slow_dec(&elem->key);
	rcu_assign_pointer(elem->funcs, NULL);
}
funcs:回调函数数组,tracepoint的作用就是在桩函数被命中时,依次调用回调函数数组中的 probe 函数。
(3)
#ifdef CONFIG_TRACEPOINTS

/*
 * it_func[0] is never NULL because there is at least one element in the array
 * when the array itself is non NULL.
 *
 * Note, the proto and args passed in includes "__data" as the first parameter.
 * The reason for this is to handle the "void" prototype. If a tracepoint
 * has a "void" prototype, then it is invalid to declare a function
 * as "(void *, void)". The DECLARE_TRACE_NOARGS() will pass in just
 * "void *data", where as the DECLARE_TRACE() will pass in "void *data, proto".
 */
#define __DO_TRACE(tp, proto, args, cond, prercu, postrcu)		\
	do {
      								\
		struct tracepoint_func *it_func_ptr;			\
		void *it_func;						\
		void *__data;						\
									\
		if (!(cond))						\
			return;						\
		prercu;							\
		rcu_read_lock_sched_notrace();				\
		it_func_ptr = rcu_dereference_sched((tp)->funcs);	\
		if (it_func_ptr) {
      					\
			do {
      						\
				it_func = (it_func_ptr)->func;		\
				__data = (it_func_ptr)->data;		\
				((void(*)(proto))(it_func))(args);	\
			} while ((++it_func_ptr)->func);		\
		}							\
		rcu_read_unlock_sched_notrace();			\
		postrcu;						\
	} while (0)
__DO_TRACE宏是用来依次执行 tracepoint 上注册的 probe 函数。
tracepoint提供了统一的框架,用void *指向任何函数,所以各个tracepoint取出桩函数指针后,需要转换成自己的函数指针类型,TP_PROTO(data_proto)传递函数指针类型用于转换。
如果跟踪点使能,在 while 循环中,依次执行回调函数数组 struct tracepoint_func __rcu *funcs 的 回调函数 func ;即依次执行 tracepoint 上的注册的 probe 函数。
四、sched_switch例程
以 tracepoint :TRACE_EVENT(sched_switch)为例,看一下内核中 sched_switch tracepoint 的 probe函数:
/*
 * Tracepoint for task switches, performed by the scheduler:
 */
TRACE_EVENT(sched_switch,

	TP_PROTO(struct task_struct *prev,
		 struct task_struct *next),

	TP_ARGS(prev, next),

	TP_STRUCT__entry(
		__array(	char,	prev_comm,	TASK_COMM_LEN	)
		__field(	pid_t,	prev_pid			)
		__field(	int,	prev_prio			)
		__field(	long,	prev_state			)
		__array(	char,	next_comm,	TASK_COMM_LEN	)
		__field(	pid_t,	next_pid			)
		__field(	int,	next_prio			)
	),

	TP_fast_assign(
		memcpy(__entry->next_comm, next->comm, TASK_COMM_LEN);
		__entry->prev_pid	= prev->pid;
		__entry->prev_prio	= prev->prio;
		__entry->prev_state	= __trace_sched_switch_state(prev);
		memcpy(__entry->prev_comm, prev->comm, TASK_COMM_LEN);
		__entry->next_pid	= next->pid;
		__entry->next_prio	= next->prio;
	),

	TP_printk("prev_comm=%s prev_pid=%d prev_prio=%d prev_state=%s%s ==> next_comm=%s next_pid=%d next_prio=%d",
		__entry->prev_comm, __entry->prev_pid, __entry->prev_prio,
		__entry->prev_state & (TASK_STATE_MAX-1) ?
		  __print_flags(__entry->prev_state & (TASK_STATE_MAX-1), "|",
				{
     1, "S"} , {
     2, "D" }, {
     4, "T" }, {
     8, "t" },
				{
     16, "Z" }, {
     32, "X" }, {
     64, "x" },
				{
     128, "K" }, {
     256, "W" }, {
     512, "P" }) : "R",
		__entry->prev_state & TASK_STATE_MAX ? "+" : "",
		__entry->next_comm, __entry->next_pid, __entry->next_prio)
);
register_trace_sched_switch函数将probe函数注册到 sched_switch tracepoint 上。
probe函数要与sched_switch tracepoint的函数原型一致,即:
	TP_PROTO(struct task_struct *prev,
		 struct task_struct *next),

	TP_ARGS(prev, next),
(1)
将probe函数 ftrace_graph_probe_sched_switch 与 tracepoint:sched_switch 相关联:
// linux-3.10/kernel/trace/ftrace.c

#ifdef CONFIG_FUNCTION_GRAPH_TRACER

static void
ftrace_graph_probe_sched_switch(void *ignore,
			struct task_struct *prev, struct task_struct *next)
{

	unsigned long long timestamp;
	int index;

	/*
	 * Does the user want to count the time a function was asleep.
	 * If so, do not update the time stamps.
	 */
	if (trace_flags & TRACE_ITER_SLEEP_TIME)
		return;

	timestamp = trace_clock_local();

	prev->ftrace_timestamp = timestamp;

	/* only process tasks that we timestamped */
	if (!next->ftrace_timestamp)
		return;

	/*
	 * Update all the counters in next to make up for the
	 * time next was sleeping.
	 */
	timestamp -= next->ftrace_timestamp;

	for (index = next->curr_ret_stack; index >= 0; index--)
		next->ret_stack[index].calltime += timestamp;
}

static int start_graph_tracing(void)
{

	......
	register_trace_sched_switch(ftrace_graph_probe_sched_switch, NULL)
	......
}
(2)
将probe函数 probe_sched_switch与 tracepoint:sched_switch 相关联:
// linux-3.10/kernel/trace/trace_sched_switch.c

static void
probe_sched_switch(void *ignore, struct task_struct *prev, struct task_struct *next)
{

	struct trace_array_cpu *data;
	unsigned long flags;
	int cpu;
	int pc;

	if (unlikely(!sched_ref))
		return;

	tracing_record_cmdline(prev);
	tracing_record_cmdline(next);

	if (!tracer_enabled || sched_stopped)
		return;

	pc = preempt_count();
	local_irq_save(flags);
	cpu = raw_smp_processor_id();
	data = per_cpu_ptr(ctx_trace->trace_buffer.data, cpu);

	if (likely(!atomic_read(&data->disabled)))
		tracing_sched_switch_trace(ctx_trace, prev, next, flags, pc);

	local_irq_restore(flags);
}

static int tracing_sched_register(void)
{

	......
	ret = register_trace_sched_switch(probe_sched_switch, NULL);
	......
}
五、TRACE_EVENT
我在这三篇文章中描述了 TRACE_EVENT :
Linux 调试之 TRACE_EVENT(一)
Linux 调试之 TRACE_EVENT(二)
Linux 调试之 TRACE_EVENT(三)
(1)
注意这里 TRACE_EVENT 宏展开是 DECLARE_TRACE 宏, DECLARE_TRACE 宏声明 struct tracepoint _tracepoint##name ,注册 tracepoint 的probe 函数,该宏在前面已经说明。
// linux-3.10/include/linux/tracepoint.h

#define TRACE_EVENT(name, proto, args, struct, assign, print)	\
	DECLARE_TRACE(name, PARAMS(proto), PARAMS(args))
(2)
注意这里 TRACE_EVENT 宏展开是 DEFINE_TRACE 宏,DEFINE_TRACE的关键是定义了struct tracepoint __tracepoint_name变量,即定义tracepoint。
初始化static key数据结构为STATIC_KEY_INIT_FALSE:
// linux-3.10/include/linux/jump_label.h

#if defined(CC_HAVE_ASM_GOTO) && defined(CONFIG_JUMP_LABEL)

struct static_key {

	atomic_t enabled;
/* Set lsb bit to 1 if branch is default true, 0 ot */
	struct jump_entry *entries;
#ifdef CONFIG_MODULES
	struct static_key_mod *next;
#endif
};

#define STATIC_KEY_INIT_FALSE ((struct static_key) \
	{
       .enabled = ATOMIC_INIT(0), .entries = (void *)0 })
// linux-3.10/include/linux/tracepoint.h

/*
 * We have no guarantee that gcc and the linker won't up-align the tracepoint
 * structures, so we create an array of pointers that will be used for iteration
 * on the tracepoints.
 */
#define DEFINE_TRACE_FN(name, reg, unreg)				 \
	static const char __tpstrtab_##name[]				 \
	__attribute__((section("__tracepoints_strings"))) = #name;	 \

	//定义struct tracepoint 结构体 和 初始化struct static_key(STATIC_KEY_INIT_FALSE)结构体
	struct tracepoint __tracepoint_##name				 \
	__attribute__((section("__tracepoints"))) =			 \
		{
     __tpstrtab_##name, STATIC_KEY_INIT_FALSE, reg, unreg, NULL };\
	static struct tracepoint * const __tracepoint_ptr_##name __used	 \
	__attribute__((section("__tracepoints_ptrs"))) =		 \
		&__tracepoint_##name;

#define DEFINE_TRACE(name)						\
	DEFINE_TRACE_FN(name, NULL, NULL);

// linux-3.10/include/trace/define_trace.h

#undef TRACE_EVENT
#define TRACE_EVENT(name, proto, args, tstruct, assign, print)	\
	DEFINE_TRACE(name)
定义 tracepoint 执行时对应的probe函数(可以是多个probe函数,可以在probe函数中定义自己的行为),将DEFINE_TRACE定义的 struct tracepoint _tracepoint##name 变量与probe回调进行绑定,这样在执行到 tracepoint 时会触发probe函数。
[root@localhost ]# readelf -S xfs.ko
There are 48 section headers, starting at offset 0x181bf0:

Section Headers:
  [Nr] Name              Type             Address           Offset
       Size              EntSize          Flags  Link  Info  Align
  ......
  [17] __tracepoints_ptr PROGBITS         0000000000000000  000f7f98
       0000000000000bc0  0000000000000000   A       0     0     8
  [18] .rela__tracepoint RELA             0000000000000000  000f8b58
       0000000000002340  0000000000000018   I      44    17     8
  [19] __tracepoints_str PROGBITS         0000000000000000  000faea0
  ......
  [37] __tracepoints     PROGBITS         0000000000000000  00137520
       0000000000005df8  0000000000000000  WA       0     0     32
  [38] .rela__tracepoint RELA             0000000000000000  0013d318
       0000000000002340  0000000000000018   I      44    37     8
  ......
Key to Flags:
  W (write), A (alloc), X (execute), M (merge), S (strings), I (info),
  L (link order), O (extra OS processing required), G (group), T (TLS),
  C (compressed), x (unknown), o (OS specific), E (exclude),
  l (large), p (processor specific)
DECLARE_TRACE 宏 和 DEFINE_TRACE 宏 不一样。
从 TRACE_EVENT 的宏定义可以看到,TRACE_EVENT使用的是 tracepoint 机制。需要静态的定义桩函数,并且在插桩位置显式的调用。
宏TRACE_EVENT提供了定义跟踪点的另一种方法。trace event可以使用 tracepoint 机制,内核其它机制也可以使用 tracepoint ,只是kernel的绝大部分tracepoint都是trace event在使用,trace event也必须向tracepoint注册自己的回调函数,这些回调函数的作用就是在函数被命中时往ring buffer中写入trace信息。内核提前帮我们实现了钩子(hook)函数并挂到tracepoint上,当使能一个 trace event 时,它会输出内容到ftrace ringbuffer中,这样就可以获取到内核运行信息了。
六、跟踪点的开销
当跟踪点被激活时,它们会为每个事件增加少量的CPU开销。当跟踪点“关闭”时,除了添加一个微小的时间惩罚(检查分支的条件)和空间惩罚(在插入指令的函数末尾为函数调用添加几个字节,并在单独的部分中添加一个数据结构)之外,它没有任何其它影响。
禁用的跟踪点变成了少量指令:对于x86_64,它是一个5字节的无操作(NOP)指令。在函数的末尾还添加了一个跟踪点处理程序,这会稍微增加其文本大小。虽然这些开销非常小,但在向内核添加跟踪点时,应该分析和理解它们。
跟踪点往往不是单独使用,跟踪点只是内核中的数据源,还有内核中的跟踪框架和用户态的前端工具也会有一定的开销:

数据源:内核中提供数据的来源(也有用户态的数据源,比如:uprobe)
Tracing 框架:负责对接数据源,采集解析发送数据,并对用户态提供接口
前端工具/库: 对接Tracing框架,直接与用户交互,负责采集配置和数据分析
跟踪工具(比如:trace-cmd,perf等等)可以增加 post-process events 的CPU开销,以及记录事件的文件系统(debugfs或者tracfs)开销。开销是否高到足以干扰生产应用程序取决于事件的速率和CPU的数量,这是使用跟踪点时需要考虑的问题。
在当今的典型系统(4到128个CPU)上,我发现低于每秒10000个的事件速率的开销可以忽略不计,只有超过100000个的开销才开始变得可测量。作为事件示例,您可能会发现磁盘事件通常小于每秒10000个,但调度程序事件可能远远超过每秒100000个,因此跟踪成本可能很高。
在一些特定的系统中,发现最小的跟踪点开销是96纳秒的CPU时间。在2018年Linux 4.7中添加了一种名为原始跟踪点的新类型的跟踪点,它避免了创建稳定的跟踪点参数的成本,从而减少了这一开销。
参考资料
Linux 3.10.0
Systems.Performance.Enterprise.and.the.Cloud.2nd.Edition
https://static.lwn.net/kerneldoc/trace/tracepoints.html
https://pwl999.blog.csdn.net/article/details/80514271
https://blog.csdn.net/jasonactions/article/details/123470620
https://blog.csdn.net/Rong_Toa/article/details/116602224
https://zhuanlan.zhihu.com/p/547477490
智能推荐
懒女人的幸福生活-程序员宅基地
文章浏览阅读176次。懒女人的幸福生活懒女人,哈哈,当我听到这个词的时候,我的眼前立即出现了一幅画面“一个头发乱蓬蓬的女人,面带倦容,衣服穿得一点也不整洁,房间的床上和沙发上丢得都是平日换下的衣服,还有四处可见不用的生活用品……”晕,不要了,还是不要再想象了! 老公常说我是一个小女人,说我是一个喜欢打扮自己的小女人。不过我也喜欢装饰自己的幸福小家,打份自已和装饰自己的家这两件事..._懒女人的幸福生活下一站幸福
typdef:深入理解C语言中typdef关键词的用法-程序员宅基地
文章浏览阅读451次,点赞7次,收藏8次。假设我们有一个复杂的结构体,我们希望在代码中多次使用它,但又不想每次都写那么长的名字。int x;int y;} Point;现在,我们可以简单地使用Point来代替整个结构体的定义。函数指针的定义通常很长,使用typedef可以让代码更加整洁。现在,我们可以使用来代替。枚举类型在C语言中非常有用,但它们的名称可能会很长。现在,我们可以使用Color来代替整个枚举的定义。typedef。
VMware Workstation网络连接的三种方式原理详解与配置过程图解_vmware桥接模式如何联网-程序员宅基地
文章浏览阅读1w次,点赞9次,收藏57次。打开vmware虚拟机,我们可以在选项栏的“编辑”下的“虚拟网络编辑器”中看到VMnet0()、VMnet1(仅主机模式)、VMnet8(NAT模式):VMnet0表示的是用于桥接模式下的虚拟交换机;VMnet1表示的是用于仅主机模式下的虚拟交换机;VMnet8表示的是用于NAT模式下的虚拟交换机。同时,在主机上对应的有VMware Network Adapter VMnet1和VMware Network Adapter VMnet8两块虚拟网卡,它们分别作用于仅主机模式与NAT模式下。_vmware桥接模式如何联网
1.(地图资料篇)地图一些重要网站_mapshaper.org-程序员宅基地
文章浏览阅读565次。地图之家总目录(订阅之前请先查看该博客)地图之家:cesium+leaflet+echart+地图数据+地图工具等相关内容的介绍1、geojson与shape格式在线互转https://mapshaper.org/2、全国geojson数据下载http://datav.aliyun.com/tools/atlas/index.html#&lat=31.769817845138945&lng=104.29901249999999&zoom=43、免费的3D模型下载ht._mapshaper.org
使用Python访问Windows共享文件和文件夹内容,三个步骤五分钟搞定_python访问带密码的共享文件夹-程序员宅基地
文章浏览阅读3.8k次。在网上找了好久,大部分都是坑人的,还是凭借我自己的聪明才智,才发现了这个正确访问共享文件目录的姿势,哈哈哈。_python访问带密码的共享文件夹
高效物联网连接技术创新:ECWAN边缘协同自组网的未来——基于ChirpLAN窄带扩频技术的无线混合组网-程序员宅基地
文章浏览阅读802次,点赞16次,收藏7次。基于ChirpLAN窄带扩频技术的无线混合组网协议ChirpLAN,ChirpLAN是基于其自有的具有完全自主知识产权的ChirpIOT系列产品所推出开源的P2P或星型无线局域网络协议。ChirpLAN与LoraWAN比较类似,具有通信安全,组网方便,终端功耗低,通信距离远等特点,广泛适用于智能工厂、智能抄表、智慧城市、智慧仓储等物联网应用场景。ECWAN是一种创新性的无线组网架构,它融合了不同的无线技术,包括Chirp技术,兼容物联网的组网协议ChirpLAN,以实现多种应用需求。这种智能计量插座通过。
随便推点
数据转换:将数据转换为不同的格式-程序员宅基地
文章浏览阅读489次,点赞7次,收藏7次。1.背景介绍1. 背景介绍在现代信息化时代,数据是成为企业竞争力的关键因素之一。数据的质量和可用性直接影响企业的决策能力和运营效率。因此,数据转换成为了一项重要的技术。数据转换的目的是将数据从一个格式转换为另一个格式,以满足不同的应用需求。数据转换的应用场景非常广泛,包括但不限于:数据库迁移:将数据从一个数据库系统迁移到另一个数据库系统。数据清洗:将数据从原始格式转换为有效的数..._数据格式转换软件技术要求怎么写
XTuner 大模型单卡低成本微调实战笔记_llm微调的目的-程序员宅基地
文章浏览阅读909次,点赞17次,收藏24次。大语言模型是在海量的文本内容基础上,以无监督或半监督方式进行训练的,海量的文本内容赋予了大模型各种各样的行业知识,但是如果直接把大模型的知识用于生产实践,会发现回答不大满意,微调的目的就是让LLM在具体的场景或领域中能够得到更好的回答。常用微调模式:增量预训练和指令跟随增量预训练:给模型投喂一些新的知识,新知识是目标领域的文本内容,经过新知识学习,模型即可获得该领域更好的效果。使用场景: 让基座模型学习到一些新知识,如某个垂类领域的常识训练数据:文章、书籍、代码等指令跟随微调。_llm微调的目的
macos安装electron和electron-builder报错问题_command not found: electron-builder-程序员宅基地
文章浏览阅读1.3k次。最近公司需求,需要做一个桌面端,其中需要用到electron-builder这个插件,安装的时候使用指令"vue add electron-builder",出现报错。报这个错是因为这个插件需要Node版本在14+以上,我们升级下Node版本就行了,这里我用的是naode v14.15.1的版本,这个版本也是很稳定的。这个问题出现的原因是电脑没有安装vue脚手架导致,使用vue --version查一下版本,发现还是识别不出这个指令无法检测,这里用“安装一下便可,如果没有效果卸载旧的,使用指令"_command not found: electron-builder
COMP4300/8300 Parallel Systems Assignment 1, 2024-程序员宅基地
文章浏览阅读605次,点赞29次,收藏13次。【代码】COMP4300/8300 Parallel Systems Assignment 1, 2024。
book地址-程序员宅基地
文章浏览阅读3.2k次。http://www.study51.com/detail.asp?ArtId=218电脑书籍下载网站集锦(转载之福建电脑用户社区)我们爱技术-IT人的世界 http://www.tech521.com/main.asp泰神电脑书屋:http://www.taishen.net/ebook/编程先锋教程:http://wlbookwl.myrice.com/jck.htm绿岛教程:http://l
计算机网络中的分组交换是什么,什么是分组交换-程序员宅基地
文章浏览阅读4.9k次,点赞2次,收藏7次。分组交换(Packed Switching)也称为包交换(Packet Switching),同样也属于存储-转发方式,是现代计算机网络的技术基础。分组交换网的出现标志着现代电信时代的开始。分组交换技术的出现克服了报文交换中传输延迟大的问题。由于分组具有统一的格式、长度较短并且长度限定在一定范围内,便于在中间节点设备(如路由器)上存储并处理,分组在中间交换设备的主存储器中停留很短的时间,一旦确定了..._.什么是分组交换?分组交换包括哪几种方式